
Rain & Dust Spikes Dashboard
Project in Data Engineering & Scientific Computing at ESIEE Paris, co-authored with two classmates.
We built an end-to-end pipeline and dashboard to study how rainfall is associated with gamma-radiation “spikes” across metropolitan France.
Problem & data
Goal: analyse whether rain events (mm/day) correlate with higher gamma doses measured by the French monitoring network.
We combined three open datasets:
- Gamma radiation (ASNR / mesure-radioactivite.fr) – soil and water samples with radionuclide, unit, environment and GPS coordinates.
- Weather (Météo-France SYNOP) – daily precipitation totals (rain/snow), originally in Lambert-93 coordinates.
- Municipality gazetteer – commune names, population and fallback coordinates to complete missing metadata.
After cleaning and joins, the final dataset contains 171,545 measurements between 2020-01-01 and 2025-01-01 over 395 municipalities.
Pipeline & architecture
The repository is organised around a small CLI:
python main.py download
Scrape ASNR with Playwright (headless Chromium) and download the SYNOP + gazetteer CSVs intodata/raw/.python main.py clean- Project Lambert-93 → WGS84 with pyproj.
- Standardise municipality names (unidecode).
- Join radiation and weather with a BallTree nearest-neighbour search (scikit-learn).
- Export a single cleaned file
data/cleaned/data.csv(16 columns).
python main.py dashboard
Start the Plotly Dash server, load the cleaned dataset once, serialise it, then build all views and callbacks.
The app can run locally or on a remote VM (port 8050, static assets in src/assets, layouts/components in src/dashboard and src/components).
Dashboard (what the user sees)
Key interactive views:
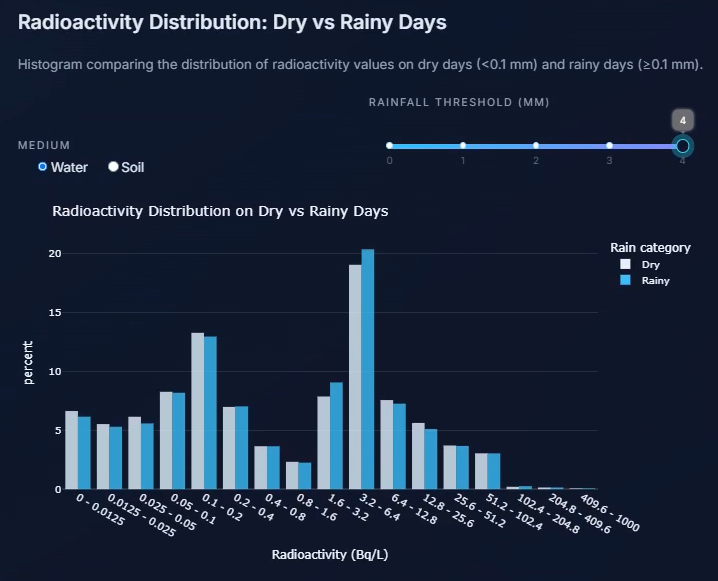
Radioactivity distribution: dry vs rainy days
Histograms comparing soil / water gamma doses on dry days vs days above a configurable rainfall threshold.Rainfall vs radioactivity scatterplot
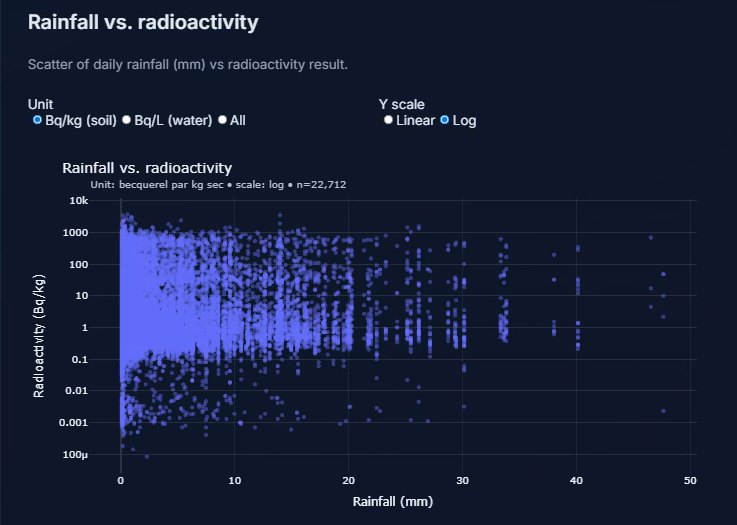
Log-scale scatter of daily rainfall vs gamma result (soil or water), with unit and Y-scale toggles.Geolocated monitoring stations map
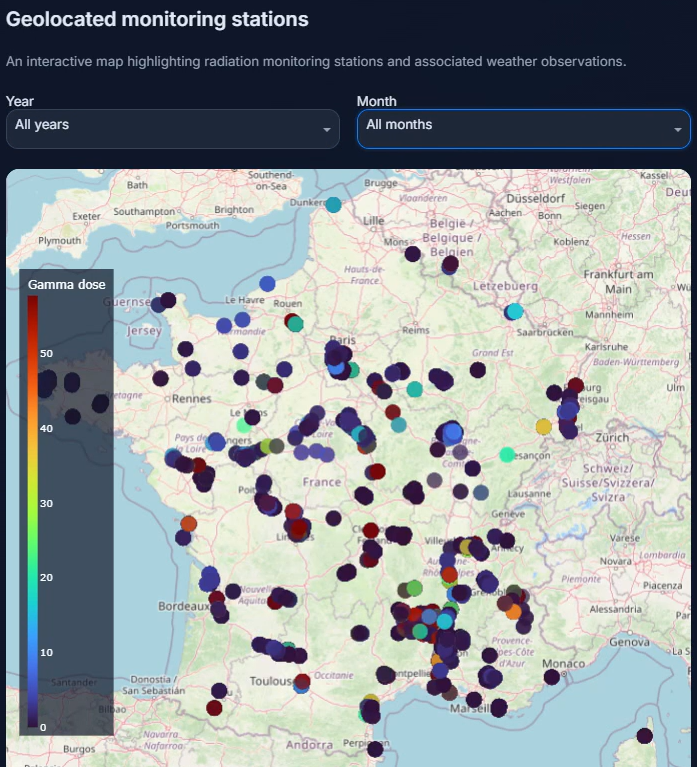
All stations plotted over France with markers coloured by gamma dose, filterable by year and month.Radioactivity by rainfall class (boxplot)
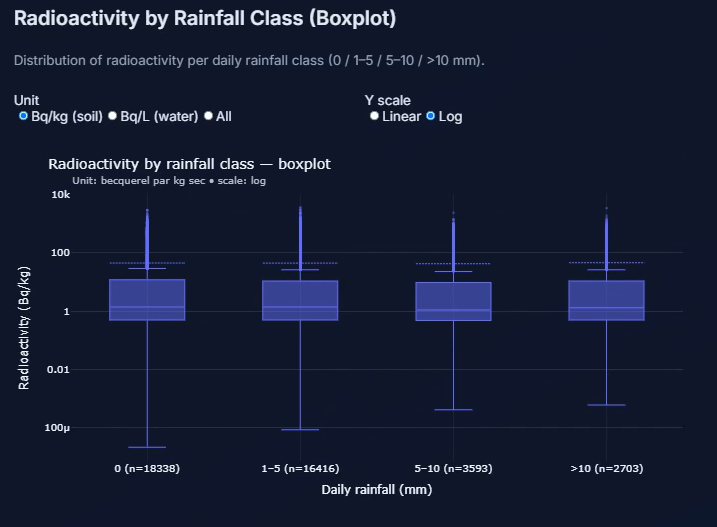
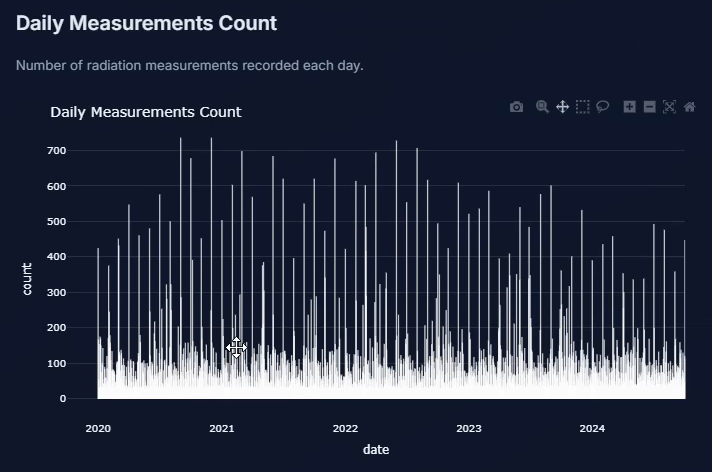
Dose distributions for rainfall classes (0 / 1–5 / 5–10 / >10 mm).Daily measurements count
Time-series of the number of radiation measurements collected each day from 2020 to 2025.
Main findings
- Heavy rain events (≥5 mm/day) are relatively rare (~14% of observations) but show a slightly higher median gamma dose (~1.1 Bq vs 0.94 Bq on drier days).
- Soil samples have higher median doses (~1.4 Bq/kg dry) than water (~0.52 Bq/L), consistent with stronger radionuclide retention in soil.
- The top decile of radioactivity measurements occurs on rainy days in roughly the same proportion as overall rain frequency (~31%), suggesting that extreme spikes depend more on local site characteristics than on rainfall alone.
My role & tech stack
My contributions
- Designed the overall CLI architecture (
download → clean → dashboard) and repository structure. - Implemented most of the data engineering pipeline (Playwright scraping, coordinate projection, BallTree joins, cleaning logic).
- Co-designed the Dash layout and callbacks, including the rainfall-class boxplots and dry vs rainy histograms.
- Wrote the final analysis summary and interpretation used in the report and presentation.
Technologies
- Python 3.11, pandas, numpy, scikit-learn (BallTree), pyproj, Playwright
- Plotly Dash, HTML/CSS for layout
- Git, virtual environments, CLI tooling